Can you help me interpret this spectrum analysis noise plot?
Can you help me interpret this 2.4GHz WiFi spectrum analysis noise plot that I just ran from my Ubiquiti Rocket M2 rooftop antenna?
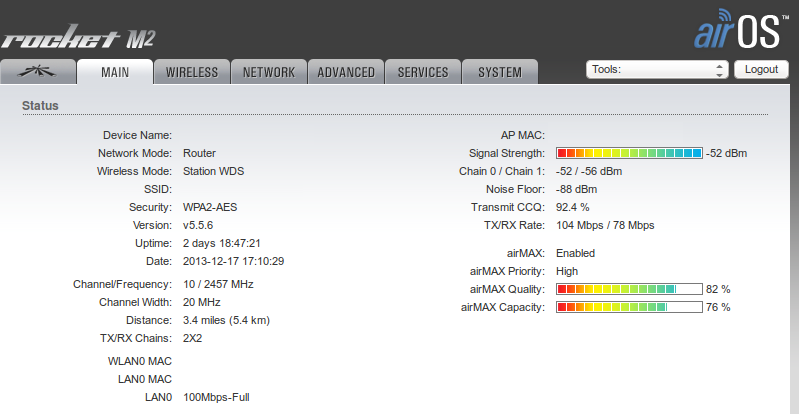
I'm trying to debug why I have -88dBm of noise at my rooftop radio.
My Rocket M2 rooftop radio is on channel 10. My home broadband router inside the house is on channel 1.
Here is the "waterfall" plot:
Here is the "channel" plot:
And, here's a view of the rooftop radio signal to noise strength:
Any observations with respect to the source of the -88dB noise? (I don't really know how to interpret this stuff.)
read more and respond »Posted 5 years ago by Danny D'Amico in Wireless Networking